XAG USD Higher/Lower Trade with Binary.com
Today’s trade will focus on another asset class; that of the commodities. It features the pairing of XAG/USD, or the pairing of silver and the USD. Silver is also known as Argentium, hence the “AG” in the “XAG”. A quick look at the daily chart shows that the asset has recently bounced off its recent lows and is therefore in an uptrend. The market bias for the asset is therefore bullish, and this will guide our approach to the trade setup.
Trade Information
- Asset: Silver/USD (XAG/USD)
- Binary Options Trade Choice: HIGHER (Higher/Lower contract)
- Expiry Time: 1 hour
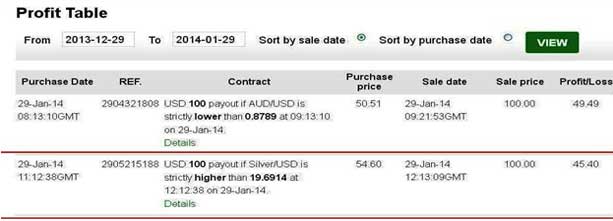
- Entry price: 19.6914
- Investment: $54.60
- Payout: $100
In keeping with the bullish market bias of the asset, we have decided to trade with the trend to pick a binary option which will mirror this bullish sentiment. I therefore chose the HIGHER option in the Higher/Lower trade contract. The HIGHER contract is equivalent to a CALL option and the terms of this option is that the XAG/USD would end the trade at 12:12pm GMT strictly above the entry price of 19.6914. The expiry time of 1 hour was chosen because the trade was analyzed using a one hour chart. The trade was setup with an intended payout of $100, and the trade was charged at $54.60.
Trade Outcome
Here, we tell it as it is. The trade ended successfully, but only just. The trade expired at 19.6952, which was a mere 0.0031 points higher than entry price. The payout of $100 was settled and applied to the account.
The Trade Explained
The reason why the trade barely scaled through is because the price of the asset moved higher than my expected entry a few milliseconds prior to execution. My intended entry price was at 19.6612, but price jerked up 2 pips and I was given a higher fill. If my original entry was good, the trade would have had at least 4 pips of breathing space.
I chose the HIGHER contract due to the new bullish market bias for the XAG/USD. I chose a cTrader chart application to conduct my analysis. An descending channel was applied on the 1 hour chart. The descending channel was due to downside retracement from the uptrend. The technical play was to ride a break of the upper trend line of the descending channel, timing the entry to occur at the pullback to the upper trend line. Any trend lines drawn must be placed to touch the highs and lows of the price action in a channel, which was done in this case (see chart below). The outcome of the trade is seen on the chart.
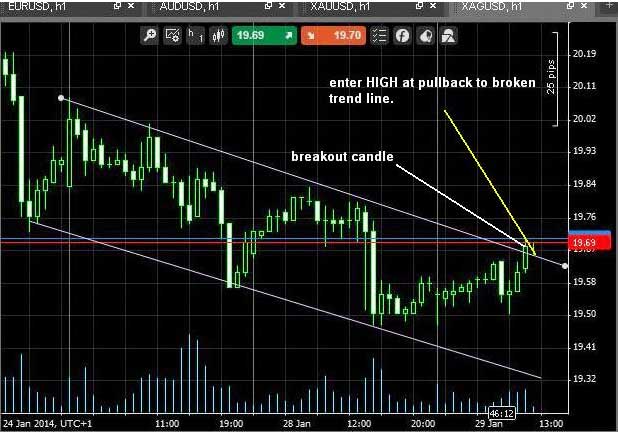
Once the pullback candle bounced off the broken trend line (which now acts as a support), the asset bounced, providing the trade signal. A 1 hour expiry time was setup because the analysis for the trade was done on a 1 hour chart, and it was expected that a single candlestick would provide the necessary price action needed for positive results.
Lessons from the Trade
So what lessons can we learn from the trade?
- This trade almost failed because of a trade entry that was less than ideal. Any entries made using breakout principles must be made exactly at the point where the candle bounces off the support or resistance line following a pullback. This is very important and can make the difference between a winning trade and a needless loss.
- Expiry times should be devised from the time frame used for trade analysis.
- Use interactive charts with indicators and tools for chart studies to perform trade analyses.
- All trades must be done in the direction of the pre-existing trend. Use the daily chart or 4 hour chart to see which direction the asset is trending, then step down to a lower time frame chart to perform the necessary analysis.