Volatility Smiles in Binary Options
Volatility smiles are part of the volatility indicators, and are defined as areas on the chart in which the implied volatility of options based on the same underlying asset with same day expiry forms a U-shape on the chart across the various strike prices. The volatility smile is one of the two curves that chart implied volatility. A volatility smile forms as options go deeper In-The-Money (ITM) and deeper Out-Of-The-Money (OTM), forming a curve in the shape of a smile, hence the term Volatility Smile. We can also say that the leaning of this curve to one side of the other is a reflection of whether the asset will end up making a bearish move or a bullish move.
 Volatility smiles form when strike prices of options which are out of the money have an implied volatility that is either higher or lower then ATM (at the money) options. The Volatility Smile is a signal to a binary options trader that as the asset nears expiry, the demand for In-The-Money (ITM) options and Out-Of-The-Money (OTM) options begins to far exceed those of At-The-Money (ATM) options. When this type of curve structure occurs, a trader can take advantage of this situation in a number of ways.
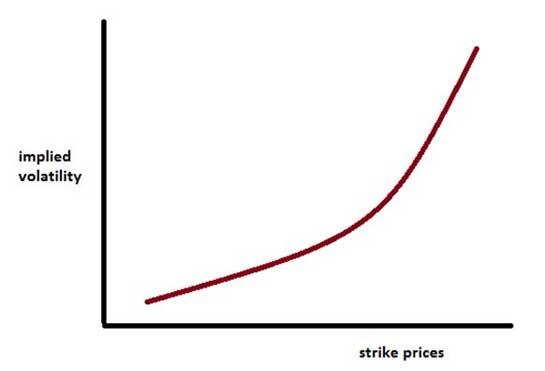
A typical volatility smile shows a plot of the options contracts on the x-axis against the implied volatility on the y-axis. If the smile is oriented to the left such that that the ITM side of the options contracts is located at a higher level of implied volatility, then this is a bearish sign. If the smile is oriented to the right such that the OTM contracts are located at a higher level of implied volatility, then this is a bullish sign.
What Do Volatility Smiles Tell a Binary Options Trader?
Volatility smiles are hardly in a perfect straight orientation. Rather, they tend to tilt in the direction of the highest implied volatility. Usually, the ends of the curve that forms the smile shows that when the implied volatility in an asset increases, so does the chance of extreme price movements to the upside or downside happening, with speculators rushing into OTM Options and longer term investors putting their money in ITM Options.
Volatility smiles are essentially used to evaluate what the mood in the market is at any point in time. The volatility smile can tell traders whether the mood in the market is bearish or bullish, leading to the placement of trades on the put or call side of the market respectively.
The best way to demonstrate the effect of volatility smiles on the binary options bet, is to look at some examples to see whether the direction of the volatility smile conforms to the trader’s expectation on the outcome of the binary options bet.
Trade Examples
 Let us look at these volatility smile charts and see what they imply for the binary options trader who is looking at the smiles as a guide to where the binary options bet should go.
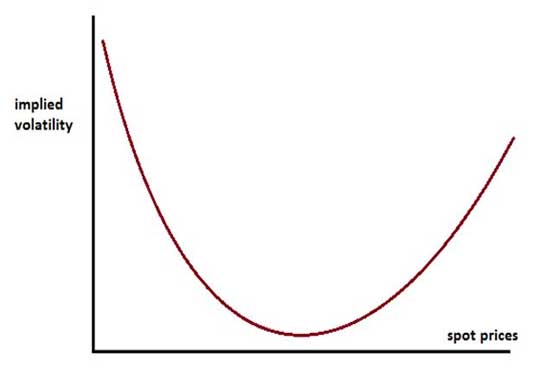
This is a typical volatility smile pattern that is seen when the mood in the market for the asset is bullish.
In other words, there is greater volatility towards ITM call contracts. Look at the pattern closely. We can see that the smile is tilted to the right where spot prices are increasing. This will lead the binary options trader to consider taking a CALL option trade.
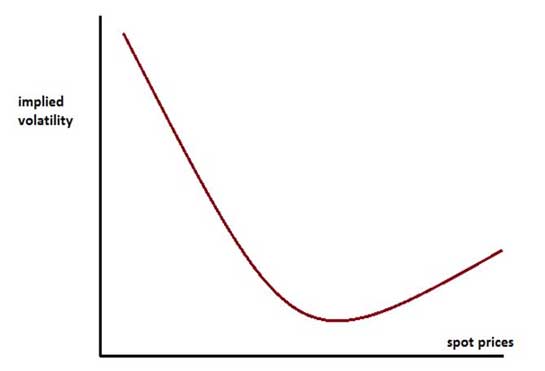
 In this example , we see a volatility chart which closely resembles a perfect smile, with the tilt of the smile almost in a straight, proportional fashion. Here, the bias for the trade started on a bearish note with a tilt towards the ITM puts, but we also see the smile getting broader to see a rise in implied volatility as spot prices increase, such that the smile almost starts and ends at the same horizontal point.
This is the scenario that occurs in a sideways market, with prices rising and ebbing within a particular range. This will interest traders who are interested in the boundary options, where there is an option to choose IN, with price staying within a range.
 In this example, there is a bias towards the bearish end of the market, but this bias is not strong as there is a little bit of a tilt towards the bullish end of the market as well.
So even though we see more implied volatility when the spot prices are low, we see the implied volatility not entirely flat when spot prices are rising.
This will represent a tricky situation to the trader: would it be wiser to trade based on the high implied volatility when the put option is in the money, or trade based on a rising implied volatility when the call option is in the money?
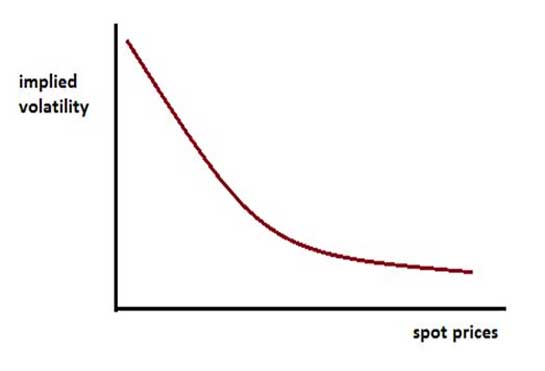
Our last example shows a volatility smile that occurs when the asset is decidedly bearish.
We can see that the implied volatility is highest when we have a reduction in spot prices; the bias of the smile is shifted to the left.
Conclusion
The problem with volatility smiles is that on their own, they cannot be used as the only tool of analysis of market mood. The trader has to use other indicators to back up the information provided by the volatility smile before deciding on a trade. In addition, volatility smiles charts are not readily available, and can only be obtained through the use of special software, which will obtain price data in order to plot the smile.
Traders can use different strategies to make profit from the volatility smile setup. The key to successfully deploying this in the binary options market is to be able to detect when the volatility smile is either cheap or at a premium relative to the at-the-money implied volatility. Different tools should be used by the trader to gauge the direction of the volatility smile, in order to enhance the potential for profiting from them in the binary options market.