Triangle Trading Strategy
The triangle trading strategy as far as binary options is concerned has to do with the use of the triangle chart patterns to create a strategy to trade the several binary options contracts available on the various trading platforms. In order to perform this accurately, we need to make the following considerations:
- The trader must be able to identify and trace the triangle patterns correctly.
- The triangle patterns can be used to trade different binary options contracts.
- All binary options trades must expire at some point, and the expiry times for each trade may either be set by the trader (on proprietary platforms) or must be chosen from several expiry times provided by the broker (turnkey platforms).
In order to trade the binary options contracts using the triangles patterns, we need to follow a sequence which will take care of the considerations listed above.
IDENTIFICATION AND TRACE OF THE TRIANGLE PATTERNS
Three triangle patterns have been identified in the financial market. These are:
- Symmetrical triangles
- Ascending triangles
- Descending triangles
However, proponents of the Elliot wave patterns system of analysis have discovered that apart from the three patterns mentioned above in which the trend lines that form the sides of the triangle usually converge, there is a triangle pattern in which the trend lines diverge from each other in a symmetrical fashion, and produces similar signals. In other words, a fourth triangle pattern exists which is the opposite of the symmetrical triangle. This is also known as the broadening triangle.
In order to identify a triangle, it is essential to first draw the trend lines that define the borders of such a triangle. A proper trend line must be shown to connect the highs of at least three candlesticks, and the lows of at least three candlesticks. These will now form the upper and lower borders of triangle, which will converge towards each other in the first three triangle types, or diverge from the apex in the broadening triangle. This process can be done manually. If you do not wish to do this manually, then you can subscribe to the Autochartist Chart Pattern Recognition tool which identifies and traces these patterns automatically. Manual traders can also use the web-based version of this tool to pick out possible triangle formations, then head over to their charts to identify and perform the traces with their line tool manually.
BINARY OPTIONS TRADING WITH THE TRIANGLES
The following trade contracts on the various binary options platforms can be traded with the triangle patterns:
- Direction-based contracts such as the CALL/PUT options. Also known as UP/DOWN, RISE/FALL, ABOVE/BELOW. This contract is found on all binary options platforms.
- TOUCH/NO TOUCH options. This option is found on Binary.com and the Tech Financial platforms such as OptionFair and 24Option.
Symmetrical Triangle
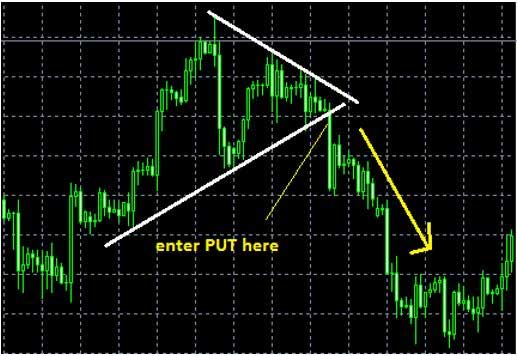 A symmetrical triangle has two sloping trend lines which converge towards each other somewhat symmetrically. There are two possible outcomes for a trade with the symmetrical triangle: the price action can either break to the upside or to the downside.
Usually the outcome is not known when the price action is within the boundaries of the triangle, so the trader must wait for the price action to break one of the two borders. It is the direction of the break that the trader must set his contract. We see in the chart below that the price broke the lower border, so the trade here is a PUT option.
Ascending Triangle
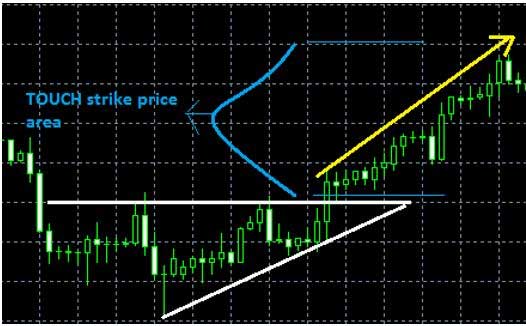 An ascending triangle has a horizontal upper trend line and a lower trend line which ascends to meet it in an upward slope.
The bias for an ascending triangle is up, because price is expected to break out of the upper boundary of the triangle.
Thus with such an assured outcome, the trader should trade both a CALL option, as well as choose an area just above the upper trend line as the strike price for a TOUCH trade.
Broadening Triangle
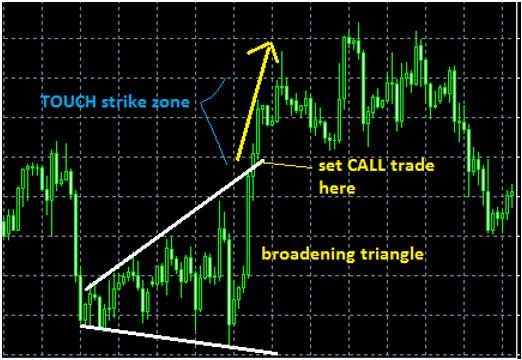
A broadening triangle has two sloping trend lines which diverge from each other.
Like the symmetrical triangle, the trader must allow the price action to break through one of the boundaries before setting a trade in that direction.
We can also see the area where the strike price for the TOUCH trade should be located.
The trader must allow the breakout to occur before setting the trade.
Descending Triangle
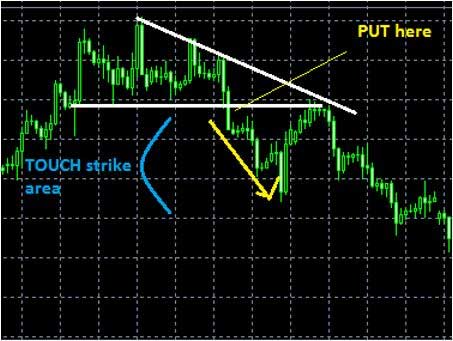
A descending triangle has a horizontal lower trend line and an upper trend line which converges towards it in a downward slope.
The price action is expected to break the lower trend line as price moves towards the apex of the triangle.
The trades here would be a PUT, as well as a TOUCH trade using the region immediately below the lower trend line as the strike area.
EXPIRY TIME SETTINGS
Use the time frames to estimate how long your expiry times should be. In these examples, a four hour chart was used for analysis. In order to allow enough time for the trades to move in our direction, it is a good idea to allow at least two candlesticks in length for the CALL/PUT trades (i.e. 8 hours) and at least 6 candlesticks (48 hours) for the TOUCH option. Modify according to the time chart used in trade analysis.