Significance of Cycles in Binary Options
What are cycles?
 According to the Foundation for the Study of Cycles (FSC) Inc, a cycle is a rhythmic fluctuation that repeats over time with reasonable regularity. When it is sufficiently regular and persists over a long enough span of time, it cannot reasonably be the result of chance. The longer a non-chance rhythm continues, the more predictable it becomes.
Cycles refer to trends that are found in a particular market environment, which dictate the reaction or performance of some underlying assets or certain asset classes, moving them to either outperform other assets or under-perform relative to other assets or the asset classes as a whole.
Cycles may also be used to describe trends that occur within a particular industry or sector and which are created by certain factors such as new products or change in regulatory environment. In other words, some of these trends or patterns that constitute cycles are usually repetitive, occurring after a particular time frame with a high degree of regularity, and can be used to predict the behavior of assets or asset classes based on their response to previous cycles.
Market cycles draw a great contribution from fundamental and technical indicators. For technical indices, charting is especially important, making use of prices of the various assets and other parameters as a barometer of cyclical behavior. Cycles are not peculiar to the binary options market, but are a feature of every financial market.
History of the Study of Market Cycles
Edward Russell Dewey was a Harvard-trained Economist who was able to study the financial markets and identified a number of market cycles operating in the U.S. economy. This mostly stemmed from a study done on behalf of the Department of Commerce in 1931, in which Dewey in his capacity of Chief Economic Analyst for the Department, was to find out the causes and market dynamics behind the Great Depression. Dewey’s study led him to come to the following conclusions:
- Just as there were cycles in nature, so also there were cycles in the financial markets, and these cycles were of identical length.
- Similar cycles from different areas reached their tops and bottoms at the same time.
Cycles in Binary Options
The FSC has found that cycles occurring in rhythms are a feature of more than 500 different phenomena, and they persist without changes in period dating back to as far back as when data are available. Even when distortions to cycles have occurred, the cycles will return to their original rhythm.
Cycles of the same time period show a tendency towards synchronization. They will form a crest or trough at roughly the same calendar time, irrespective of whatever phenomena are at work.
 The presence of an identical rhythm even in the presence of different phenomena shows an interrelationship between assets or events.
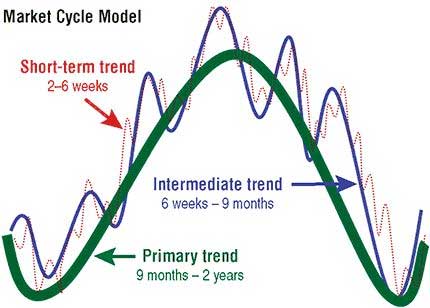
The knowledge of predictable, repetitive patterns is therefore a valuable tool in making trade projections. According to financial expert, attorney and Certified Public Accountant Stan Weinstein, stocks, sectorial stock assets and the markets as a whole have major cycles that occur in four stages. This is not a surprise, as the activities of traders are mostly responsible for these phases of a cycle in the stock markets.
No matter what market is under consideration, all will be found to be cyclical. They will rise, form a peak, fall and then bottom out. When one cycle is over, the next one will follow.
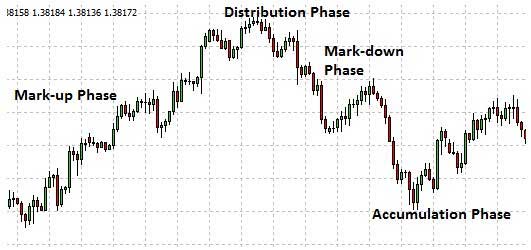
The four stages that make up a cycle are as follows:
- Accumulation
This phase follows a market bottom. Here we see the smart money moving in and buying assets with the belief that the market will start to pick up. This is the stage where assets are at their cheapest and valuations are highly attractive. Funny enough, just as the smart money traders (institutional insiders, hedge fund managers and experienced traders) are moving in, the rest of the market (the retail money) are fearful, apathetic and still generally bearish, with many fearing the worst and selling off all their holdings, swearing that the market is all one huge scam.
However, what is truly happening in this phase is that the smart money guys are buying up cheap, and negative market sentiment gradually gives way to a neutral one.
- Mark-Up Phase
This is when the market starts to inch higher. At this stage, market technicians have started to see that market direction is changing. As this phase progresses to completion, more people join the bandwagon and the herd effect starts to take shape.
As this phase ends, market volumes start to rise greatly, and greed sets in, with all fundamentals relegated to the background. This is when the smart money guys start to get out, offloading their positions on the greedy newcomers. As this continues, more and more of the herd jump in. A look at the chart will see a parabola, showing rising volumes and hitting a selling climax. At this stage, the mass sentiment in the market is that the markets/assets will remain bullish, money will be made and life will become sweet ever after.
- Distribution Phase
By the time the market is in the distribution phase of the cycle, alarm bells have begun to ring. Returns start to level out and sellers begin to dominate. This phase is when we start to see chart patterns such as double tops and head and shoulders top patterns. The market stays stuck in a range, with short term price movements to the upside and downside. Any time an upside occurs, it ignites hope in those still holding positions that the market may yet take off on another huge rally.
At this stage, if there is a systemic news event which is bad for the market (such as the collapse of Lehman Brothers in 2008), it can trigger a massive sell-off.
- Mark-Down Phase
This stage is what drives many retail traders into mourning. By this time, those still holding positions would have incurred hefty losses after having bought high and being forced to sell low. Funny enough, when they sell, it is the smart money buyers who will buy the cheap assets off the battered retail money traders. What an irony!
For traders who want to benefit from cycles in binary options market, they would need to monitor the markets to know when any of the four phases is at work. Cycles can last for a few weeks, months or even years. Right now, the US markets are in a stage of mark-up, with markets being fed on stimulus money from the Fed Reserve. When will the next bubble occur? Will late 2014 be the time that the markets will enter a distribution phase?
Furthermore, we also need to understand that different assets have varying cycle lengths.
Conclusion
The advantage of the binary options market is that it gives traders the opportunity to trade several assets, all of which have their own respective cycles. The key is to identify the opportunity to take positions like the smart money traders, buying at the accumulation phase when the rest of the herd are not alive to the opportunity.
Analyzing cycles will require that the trader has access to historical charts. One source of such historical charts is TechSignal, a partner of the Foundation for the Study of Cycles. With these charts, the trader can look out for opportunities where these smart-money contrarian trades can be initiated.