Fibonacci Time Zones Strategy for Binary Options
The Fibonacci Time Zone indicator is another tool out of the Fibonacci stable which is based on the Fibo ratios and works just like the Fibonacci retracement and expansion tools. However, the Fibonacci Time Zone indicator plots the areas where reversal of price action is to be expected as vertical lines as opposed to the horizontal lines of the retracement and expansion tool.
The starting point of the Fibonacci time zone strategy is to be able to draw it correctly on the charts, understand what the vertical lines signify and then use the information derived therein to create a strategy for trading the binary options market. Since this is a reversal strategy, it is best suited to trade the Call/Put strategy.
Drawing the Fibonacci Time Zones on the Chart
The Fibonacci Time Zones tool is based on a sequence of numbers known as the Fibonacci ratios. These number sequences are derived by adding the previous two numbers to get a third number. The sequence is thus listed as follows: 1, 2, 3, 5, 8, 13, 21, 34, 55, 89, etc). You can see that 1+2 = 3, 3 + 5 = 8, and so on. This will be reflected in the appearance and spacing of the time zone lines as they are plotted on the chart.
The Fibonacci time zone tool is drawn either from a swing high to low, or a swing low to high depending on what the trend of the asset is. The indicator will then draw the vertical lines that represent each time zone automatically. The lines tend to cluster at first, reflecting the closeness of the numbers that constitute the number sequence, and from there the lines tend to become less clustered. These lines are potential reversal points. After the lines are plotted, they will look something like what is shown below:
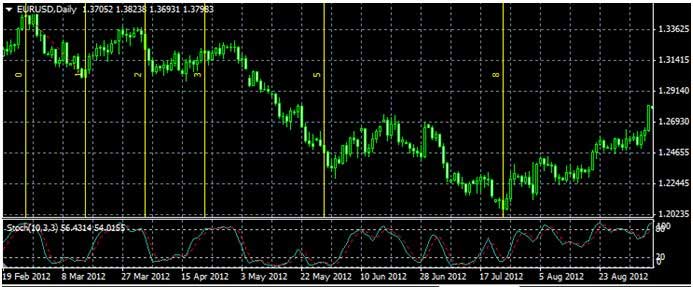 The chart shows the Fibonacci Time Zone ratios drawn on the daily chart of the EURUSD. We will see here that the tool was drawn from a swing high to swing low, and we can see possible reversal points at time zone ratios 1 and 8. Many authorities will advise ignoring the first 5 time zone ratios, but then if you use a long term chart such as the daily chart as shown above, you can still find opportunities between the clustered areas.
Usually, the Fibonacci Time Zone tool is not super-accurate when it comes to picking out these reversal points. The tool must be combined with other indicators of technical analysis, as well as candlestick patterns to pick out these areas of reversal as accurately as possible.
How to Trade Binary Options with Fibonacci Time Zones
The trades to take on the binary options platforms using the Fibonacci Time Zone tool are the Call option and Put option contracts. The expiry times of the contract is taken to be the time distance between time zone lines to be used for the analysis.
When you trace the Fibo Time Zone tool from a swing low to high and vice versa, note that you are doing this in real time and so the ratios that will follow will appear on the chart in areas where the price action is yet to form, i.e. the parallel vertical ratio lines will form in the future. These will therefore form areas of projections of what the price action will do at those areas. In addition, it is also pertinent to state that the initial trace must be done between a high and low that is close together, unlike in the Fibonacci retracements/expansions where the low and high used for the trace are a bit apart from each other.
CALL OPTION TRADE
 The trace for the trade can be made either from swing high to low, or from swing low to high. This is because the Fibonacci time zone ratios are not very reliable indicators for predicting the direction of price movement. Hence we will combine this trace described with our colour-coded MACD histogram indicator.
After the trace, note the colour of the MACD indicator where the time ratio line marked “2” is located. Then draw a horizontal line from the low of the candle on line 2 to the time ratio line marked “3”.
If the MACD histogram is blue at line 2, then the bias for the trade is upwards. Wait for the price action to bounce on the horizontal line between time zone line 2 and 3. If this bounce occurs on the line and at the same time the MACD histogram is blue, place a CALL option on this bounce with an 8-hour expiry time.
PUT OPTION TRADE
 Trace the time zone tool either from a swing low to swing high, or vice versa. Note the colour of the MACD histogram at the number 2 time zone line. Then trace a horizontal line from the high of the candle on line 2 across to line 3.
If the MACD histogram is red, then the bias for the trade is downwards. Wait for the price to be located below the line from line 2 to 3, and then wait for it to pullback upwards to this line. Once it is rejected at this line (i.e. no breakout above the line has occurred), then set a PUT option trade with an 8-hour expiry.
It is pertinent to state that this strategy is best performed on the 4 hour charts exclusively. Practice this on demo until it is perfected. You can also download the MACD indicator used for this strategy by clicking on this link.