Bollinger Bands in Binary Options
Bollinger Bands are a trend indicator that was invented by John Bollinger during the 80’s. They are composed of an upper, middle and lower band. The middle Bollinger band can be seen to be a 20-day moving average, and a check of the default settings of the Bollinger band on a chart will prove this. Statistically-derived standard deviations from the middle Bollinger band are used to carve out the upper and lower Bollinger bands respectively. The bands of the Bollinger are therefore derived as follows:
- Upper band at 2 standard deviations above the middle band, which will encapsulate the price action in the market about 96% of the time.
- Middle band formed by 20-day moving average.
- Lower band formed at 2 standard deviations below the middle band. This also captures price action 96% of the time.
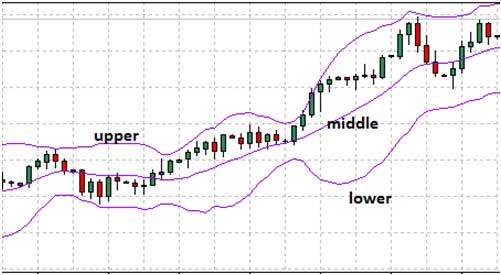
With this arrangement, the resistance of price action is located at the upper band while the support is formed by the lower band.
When being used to trade binary options, Bollinger bands need to be characterized. The most important characteristics are:
- Shape
Are the Bollinger bands contracted/narrow or are they wide? This will tell the trader if the market is range-bound (contracted) or trending (wide).
- Direction
Are the Bollinger bands pointing upwards, downwards or sideways? The direction of the Bollinger band indicates the trend of the asset.
Bollinger Band Trading Strategies
The following Bollinger band trading strategies are described below:
Strategy 1: Support-Resistance Trade Strategy
Bollinger Bands are on their own, not very accurate when it comes to their use in detecting support and resistance. This is why the addition of support and resistance lines, as well as trend lines will enhance their use in this regard.
We will therefore add a resistance line to join the highs or support line to connect the lows of the price action within a chosen time frame. Pick out an area where price action can be joined by trend lines to form support or resistance, and also see if you can apply trend lines across the highs or lows (using a different colour on your chart).
PUT Trade
The aim is to initiate a PUT contract when there is a downside break of a trend line connecting the lows when price has hit a resistance line at the upper Bollinger band as shown below:
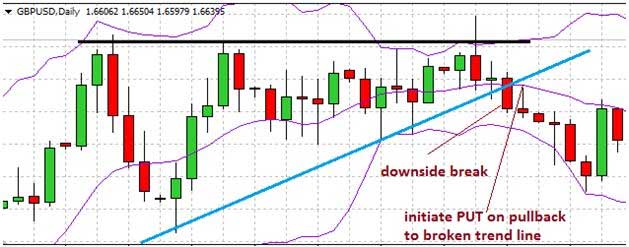
PUT trade setup
In this chart, we see that a resistance line can be drawn at the level of the upper Bollinger band to connect the price highs. A lower trend line can also be drawn across the price lows as support. A break of this support will form the basis for a PUT trade using the break out principles described in earlier articles where price is allowed to pullback to the broken trend line for precise entry.
CALL Trade
In this example, we see a support line drawn at the level of the lower Bollinger band, as well as a resistance line (in blue) drawn across the price highs. A break of this line provides the basis for a CALL trade as shown below:
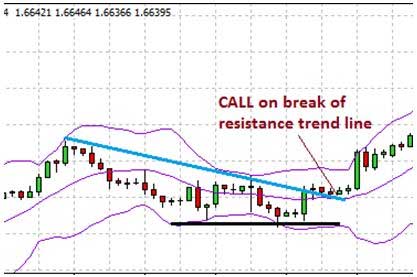
CALL trade entry setup
The tracing of the trend lines is a very important component of the entire strategy. Trend lines must first be traced to connect two points of price highs or lows, and then extended into the future to provide a basis for future price action to determine the trader’s next move.
Setting the Expiration Time
When it comes to setting expiry times, it is better to allow the price action to move the length of at least two candles. Therefore, the trader should take note of the expiry times available on his chart, as well as the time frame chart on which the analysis was done, and apply the expiry as described.
For instance, our PUT trade example was analyzed using a daily chart. Allowing two to three candles as the expiry time would mean that the expiry would be set to 3 days. The second example for the CALL option was analyzed using a 4 hour chart, and this would leave the expiry at between 8 and 12 hours.
Using these principles, the trader would then be able to give the trade enough room to breathe and end up in the money.
Strategy 2: Reversal Trade with Different Band Settings
Different Bollinger band settings can be used to create a larger range with which to capture price movement, and thus get better assessment of support and resistance with which to trade price reversals. This is achieved by introducing what is known as the Extended Bollinger Band (EBB), with settings adjusted from default levels to 13, 2.618. This means that the middle band is adjusted to a moving average of 13 periods and the standard deviation set at 2.618% from the middle band. The Extended Bollinger Band can then capture 99% of price action as opposed to 96% from the default band settings. The EBB is applied to a chart already carrying the default Bollinger band, creating two upper bands and two lower bands or a total of four bands.
So are the Extended Bollinger Bands used to trade in the binary options market? They are basically used to trade the UP/DOWN binary contracts.
DOWN Trade
Allow the price action to extend beyond the default upper band and touch the EBB. This creates an extreme price movement which provides the possibility of a reversal trade. If the price action candlestick touches or goes beyond the EBB, but fails to break through it, then a reversal DOWN trade can be taken at the open of the next candle.

Down trade setup
UP Trade
In the same vein, if the price action touches or goes beyond the lower EBB but fails to break through it, then the trader can trade UP as shown below:
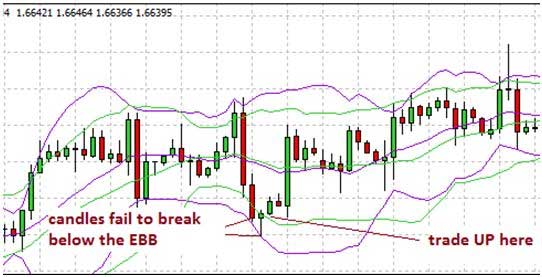
UP trade setup
Conclusion
The Bollinger band strategies described above are quite reliable, but traders must rehearse rthe strategies thoroughly, especially when it comes to setting expiry times.