Binary Options Technical Analysis – Chart Patterns
Chart patterns are another method of binary options technical analysis for the binary options market. The beauty of chart patterns is that they usually give clear-cut signals as the results of the price action which forms the patterns is usually known. There are several chart patterns in the financial markets, but for the purpose of binary options trading, it is better to restrict the chart patterns used for technical analysis to the simple ones. There is no advantage using complicated chart patterns over simple chart patterns. The aim is to detect a chart pattern when it occurs, and then trade the appropriate binary options contract that can match this pattern for profitable results.
Chart Pattern Examples
What are the chart patterns commonly seen in the financial markets? I would like to group them into simple and complicated chart patterns.
The simple chart patterns are:
- Triangles (ascending, symmetrical, descending, expanding). Wedges (falling, rising)
- Flags and Pennants
- Double top and double bottom
- Triple top and triple bottom
- Head and shoulders
- Inverse head and shoulders
The complicated chart patterns are:
- Rounding tops and bottoms
- Cup and handle pattern
- Diamond patterns (top and bottom)
Try as much as possible to stick with the simple patterns. They are more likely to be less confusing and easier to use in picking profitable trade opportunities.
Chart Pattern Identification
Previously, chart patterns required trained eyes to pick out on the charts. However, there are now software that can be used to detect chart patterns on the chart. Two of such tools are:
- Autochartist, either as the MT4 plug-in or the web-based version. My experience has shown the web-based version to be better and more accurate than the MT4 plug-in. If your binary options broker has a partnership with Autochartist, you can access the tol for free. Otherwise you would have to pay $19 a month for it.
- Interbank FX also has an MT4 plug-in. This is best used on the charts of their trading platform. So to use this tool, download the demo version of the IBFX MT4 platform and attach the plug-in to the Indicators folder. From there, it can be attached to the chart when the platform is active.
USING THE CHART PATTERNS TO TRADE BINARY OPTIONS
In this section, we show you how to use each of the patterns to trade binary options contracts.
- Wedges
Wedges are formed when the highs and lows of the candlesticks on a chart can be joined with two trend lines, both of which are either ascending (rising wedge) or descending (falling wedge). Usually, the angle of slope to the horizontal is greater in one trend line than the other. The expected price action at the end of the pattern is usually opposite to the direction the trend lines assume. Therefore, the rising wedge should be traded with a PUT, and a falling wedge traded with a CALL.
- Call Trade
 After a falling wedge has been identified, the price should be allowed to break out of the upper side of the wedge.
 Allow the next candle (i.e. the candle following the breakout candle) to pull back to the trend line. As soon as it does, initiate a CALL trade and use the length of that candle as the expiry time.
This can be traded with any time frame chart, but it is preferable to use the hourly, 4 hour or daily chart for this.
- Put Trade
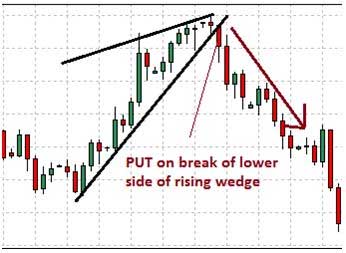 The same principle as the Call trade is used, but in reverse. The price action will break through the lower side of the rising wedge. When it pulls back to the broken line, initiate a PUT trade, using the candle length as the expiry time.
The candle length refers to the time frame used. This will be one hour in an hourly chart, four hours in a 4 hour chart and 24 hours in a daily chart.
- Call Trade
Ascending, descending or symmetrical triangle patterns are usually formed when the trend lines used to connect the price action highs and lows converge towards each other in triangular fashion. Recently, some authorities on Elliot wave patterns have added expanding triangles in which the trend lines diverge rather away from each other, but still in triangular fashion.
- Ascending Triangle
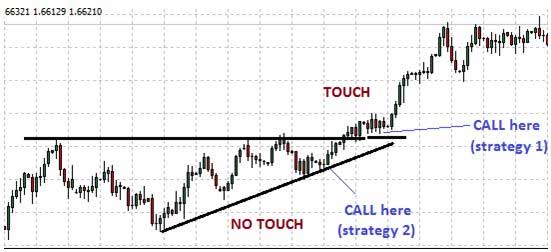 The ascending triangle is what is used for the CALL trade because the price action will break out of the upper horizontal side, after being pushed up gradually by the ascending lower side of the triangle. Two CALL trade setups are identified.
You may trade the break of the upper horizontal trend line, and initiate the CALL trade on the pullback, using the candle length as the expiry time.
Alternatively, you can take the trade while the price action is contained within the triangle, instead initiating a CALL when the price bounces off the ascending trend line.
You may also trade the TOUCH/NO TOUCH with the ascending triangle. Use any price below the ascending trend line as your NO TOUCH strike price, and use a price slightly above the horizontal trend line as your TOUCH strike price. The price action will do the rest.
- Symmetrical Triangle
The symmetrical triangle has no bias as the price may break out of any of the two sides. It is advised not to use this triangle for picking binary trades.
- Descending Triangle
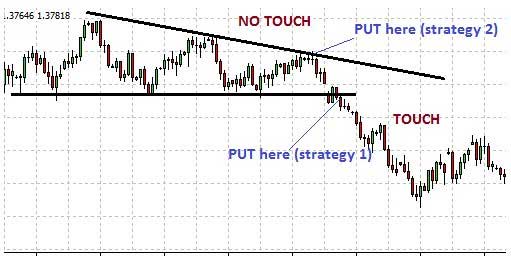 The PUT trade setup is traded with the descending triangle. Here we would expect the price to break through the lower horizontal trend line.
 When it has done so and experienced a pullback to this trend line, you can initiate a PUT trade at that point, using the candle length as expiry time.
Alternatively, you can decide to take the trade early. Once the trend lines are nearing convergence, wait for price to bounce off the descending trend line, and initiate the PUT trade from there while the price action is still within the triangle.
Flags and pennants are formed when there is a break in the trend of an asset, with a small retracement area representing the flag/pennant and a portion of the initial trend forming the pole on which the flag or pennant is hoisted (see diagram below).
The difference between the flag and the pennant is that trendlines that connect the highs and lows of the retracement area converge towards each other in the flag, but tend to run parallel to each other in the pennant. The outcome is the same. The price action is expected to break through the flag/pennant in the direction of the initial trend. Flags and pennants can occur in the uptrend or downtrend, giving us bullish and bearish varieties.
- Call Trade
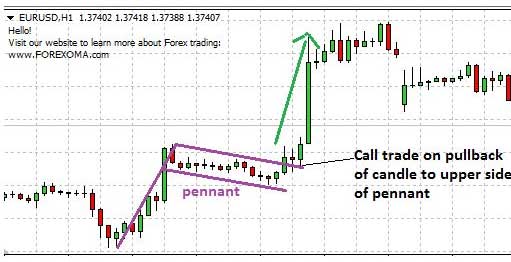 Simply identify the flag or pennant in the chart when the asset is in an uptrend, and trade the break of the upper side of the flag or pennant.
 - Put Trade
Simply perform the reverse of the call trade to get the PUT trade setup with the flag or pennant.
Conclusion
All trade setups must be thoroughly tested on demo before being applied to a real account, especially when it comes to proper expiry settings for each chart pattern.