Binary Options Technical Analysis
In the financial markets, trading decisions are usually arrived at as a result of technical and fundamental analysis. Trading of binary options therefore requires a multi-dimensional approach. The trader will come to understand that trading binary options relies very heavily on technical analysis, and in conducting technical analysis, the trader will seek to answer several questions:
- Are there any chart patterns that can be observed from the chart?
- Is the asset under observation in an identifiable trend? If yes, what is the trend of the asset? Is the asset trending downwards, upwards or sideways?
- Is there high or low volatility?
- Are trading volumes increasing or decreasing?
- What is the present relationship of the asset to any support and resistance areas on the chart? Is the asset testing those areas or has the asset broken through any of those areas?
- Is the asset price experiencing a surge in momentum?
These questions in essence cover the range of technical conditions that a trader wishing to conduct technical analysis for the purpose of trading binary options must cover. As we can see from the checklist, the trader must be able to look at the following technical conditions in an attempt to identify trading opportunities:
- Support and resistance
- Chart patterns
- Candlestick patterns
- Trend lines
- Indicators that predict momentum and volume of trade
In this article, we will examine the first of the technical checklists we have identified, which is the use of support and resistance in binary options technical analysis.
Support and Resistance
Support and resistance are key market concepts that every binary options trader must come to terms with. Support areas are price levels at which a downtrending price action is likely to halt and reverse upwards, while a resistance area is a price level where an asset in an uptrend is likely to halt before reversing downwards. Sometimes, the price action will test these areas repeatedly, and one of two things may happen:
The asset in question will reverse at the key area of support/resistance. Usually the asset would have tested the area of support or resistance several times, and the more times those levels are tested, the stronger the support or resistance will be. We see this illustrated below:
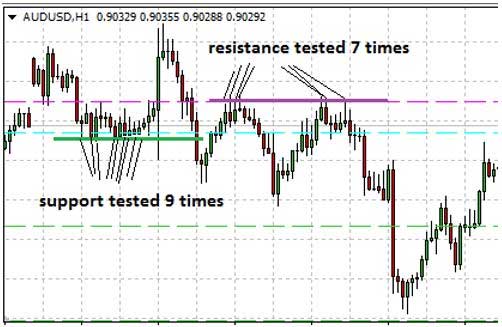
Tests of support and resistance
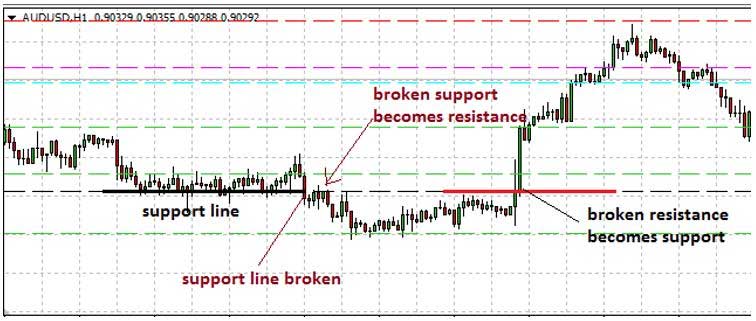
The asset may break through the key area of support/resistance. When this happens, the key areas undergo a role reversal, with a broken support now becoming a new resistance and a broken resistance becoming a new support.
These scenarios will ultimately define how a trader approaches the trading of an asset when that asset is at the support/resistance area.
The next rational question is: how is support and resistance defined on the charts? Support and resistance can be defined by:
Trend lines, in which there is an upper trend line connecting price highs (resistance) and a lower trend line connecting price lows (support). Please note that these trend lines are horizontal in orientation.
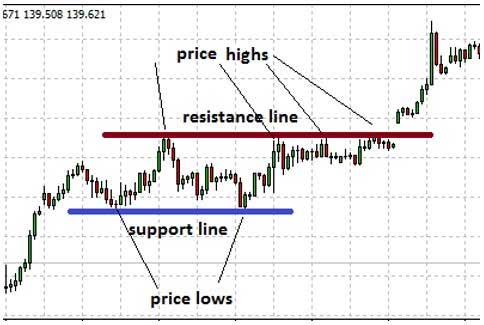
Support and resistance trend lines
Usually, support and resistance drawn with trend lines will require a visual identification of the price lows and price highs on the chart, which are then connected with trend lines as shown in the snapshot above.
Support and resistance can also be identified by the use of pivot points. There are seven daily pivot points, and these are usually calculated using a formula that takes into account the high, low and closing prices for the previous day. These pivot points (R1, R2, R3, central pivot, S1, S2 and S3) can now be calculated automatically using a pivot point calculator. Several of these pivot calculators exist online and can be downloaded at no cost. When applied to the price chart of an asset, then the pivot points are plotted as shown on this chart:
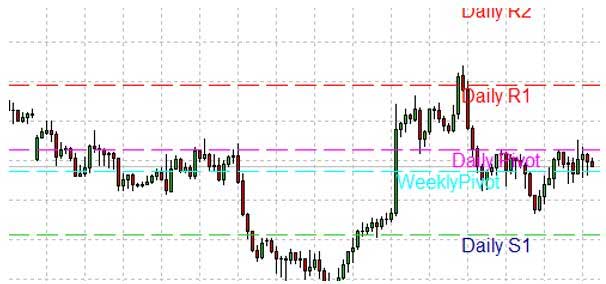
Pivot points showing daily pivot, S1, R1 and R2
There are several factors that can cause price action to either reverse at support or resistance levels, or to break through those levels. Sometimes, these factors can be identified by the use of indicators on charts. Some of these indicators are volume indicators, momentum indicators (e.g. Stochastics oscillator) or trend indicators such as moving averages.
Trading Support and Resistance in Binary Options
When trading support and resistance areas in the binary options market, there are certain factors to consider:
- What expiry time will the trader be setting for the trade?
- Following on from (a), what time frame chart should the trader be using?
- How strong is the support or resistance level? Should the trader be trading a reversal or a breakout trade?
When considering the expiry time for the trader to be taken on the basis of support or resistance, it is pertinent to consider how strong such a level is. Obviously, support or resistance areas on longer time frame charts will be much more solid than those on short term time charts. So let us assume that a trader uses a 4 hour chart and identifies support and resistance areas which can be traded, what expiry time should be used for the trade? Another way of asking the question is: if the price has been identified to be at a particular price level, is this level at a support or resistance area and if it is, on what time frame chart is this occurring? Definitely, 4 hour or daily charts will offer stronger support/resistance areas which should attract a minimum of one week expiry in any trade being set.
If pivot points are used to define support and resistance areas, these should attract a maximum expiry time of one day. This is because the pivot points are calculated with the previous day’s price action, and so any decisions made on these pivot points should usually be done on an intraday basis.
As for the question on whether to trade a reversal or trade a breakout at the identified support or resistance area, this will depend on the behavior of the reference candlestick on the price chart. For a breakout to have occurred, the candlestick must close beyond the support or resistance. If the candlestick merely breaches the key level and fails to close beyond it, then this is a failed breakout attempt as depicted below:
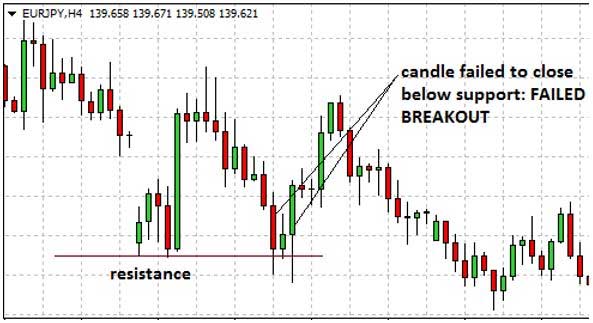
Notice how the price candle merely breached the key level but failed to close below the support. In this case, the price action is likely to reverse and we see this happening with the failed breakout candle assuming a very bullish move, followed by other candles which served to push the price even higher.
However, when the price action candlestick closes beyond the key price level, then the breakout is complete and the trader can then set a binary options trade (either CALL or PUT) in the direction of the breakout. Usually the candlestick after the breakout will attempt to return to where the price was coming from, but because the broken key level will undergo a role reversal as described earlier, the price action pullback will be rejected at the key level and the price will now be free to move in the direction of the breakout. We see this clearly illustrated in the snapshot below:
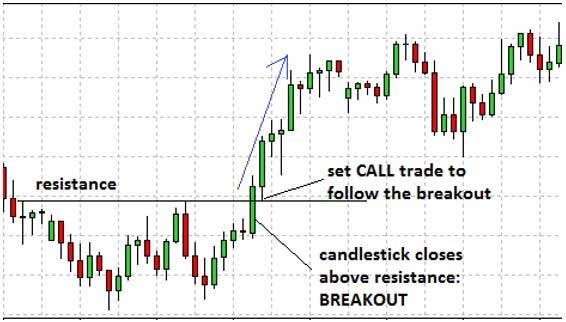
Breakout of resistance
Here we see the candlestick breaking above the resistance, followed by a pullback to the resistance line now turned support, and price action moving thereafter in the direction of the breakout. The trader’s move should be a CALL trade, since the trade bias is to go upwards in the direction of the breakout.
In the next article, we will look at the second component of technical trades, which is the use of trend lines in binary options technical analysis.