F5 Networks signals downtrend on lackluster Q1 view
 The stock of content management solutions provider F5 Networks, Inc. (NASDAQ: FFIV) had a remarkable run up this year. Since February 11th , the stock has appreciated by about 69% to $146.56 (as of Tuesday’s close). The company reported a 5% y-o-y increase in the fiscal 2016 fourth-quarter revenue to $525 million.
F5 Networks reported fourth-quarter non-GAAP net income of $140 million or $2.11 per share, compared with non-GAAP net income of $130 million or $1.84 per share in the similar period of 2015. The quarterly revenue and earnings were higher than the Wall Street estimates (earnings of $1.94 per share on revenue of $520 million).
However, the following details indicate that the stock may undergo a correction in the week ahead. F5 Networks stated that it expects revenue of between $510 million and $520 million in the first quarter of fiscal 2017.
F5 Networks, Inc.
The company also anticipates GAAP earnings in the range of $1.40 to $1.43 per share in Q1 2017. Excluding amortization of intangible assets and stock based compensation expense, the non-GAAP earnings is expected to be between $1.92 and $1.95 per share. F5 Networks is slated to report its first-quarter results on January 25, 2017.
The Wall Street analysts expect the company to report first-quarter earnings of $1.53 per share. As it can be understood, the company’s guidance is lower than the market’s expectation. Even the analysts’ forecast is about 9.5% lower than the earnings reported in the previous quarter. For 2017, the analysts’ target price for the stock ranges from $121 to $140. In particular, investment research firm Wunderlich has given a price target of $130, while Oppenheimer has given a price target of $140. The analysts at Zacks have given a consensus target price of $138.76 for F5 Networks. This means that the stock is currently trading at a premium. So, fundamentally, we can anticipate a price correction.
The historic price chart shows that the stock of F5 Networks is facing resistance at 146 levels. The MACD indicator is moving downwards. This indicates a loss of momentum in the stock. Thus, a decline in the share price can be expected.
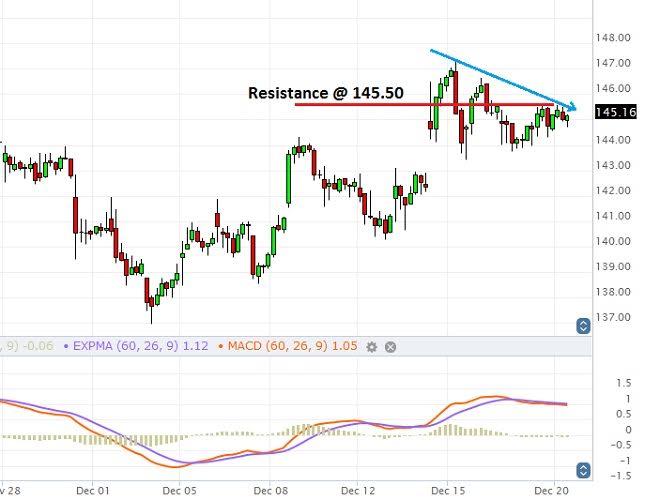
F5 Networks Stock Price: December 21st 2016
On the basis of the above analysis, a trader should consider investing in a low or below contract. The binary trader should invest in the low contract only if the stock trades above $145.50. An expiry time of one week should be selected for the trade.

Related Articles

European Countries to Weigh Pros and Cons of Financial Transactions Tax
A financial transactions tax, which was proposed by John Maynard in 1936, may soon be passed and implemented in 11

Home Depot to break yearly high on strong FY16 outlook
The share price of the world’s largest home improvement retailer, Home Depot, Inc. (HD), is on the verge of breaking

Loss of US media contracts keeps Publicis Groupe bearish
The advertising and public relations company Publicis Groupe S.A. (OTC: PUBGY) is due to release its fiscal 2016 third-quarter results